Every business generates data every day. Sales reports, customer records, marketing campaigns, financial transactions, inventory updates, website traffic, and operational activities all produce valuable information. However, collecting data alone is not enough. The real challenge is understanding that data and converting it into meaningful business insights.
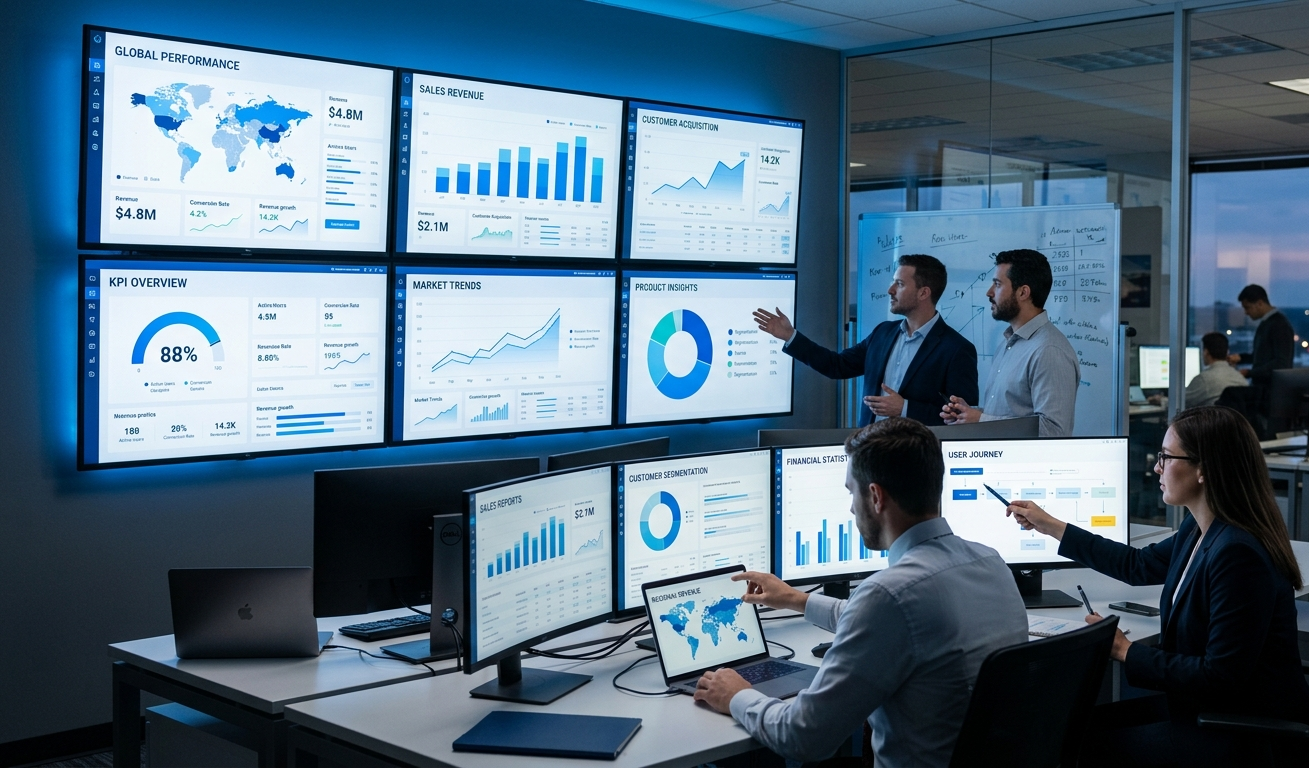
This is where Business Data Visualization becomes extremely valuable. Instead of looking at large spreadsheets filled with numbers, businesses can view information through interactive charts, dashboards, graphs, and reports that make decision-making faster and more effective.
Many organizations today struggle because is important business data is scattered across different systems. Teams spend hours preparing reports, analyzing trends, and finding useful insights. With proper Business Data Visualization Solutions, businesses can transform complex information into easy-to-understand visual formats that help management make informed decisions quickly.
One of the biggest advantages of data visualization is clarity. Business leaders can instantly identify sales trends, customer behavior patterns, operational bottlenecks, revenue performance, and growth opportunities without spending excessive time reviewing raw data. Visual dashboards simplify information and improve overall business efficiency.
As competition continues increasing across industries, businesses are relying more on data-driven strategies. Companies that can understand their data effectively often make better decisions than those relying solely on assumptions. This is why organizations are increasingly working with a professional Data Visualization Company to create customized dashboards and reporting systems.
Startups especially benefit from visualization tools because they need quick access to performance metrics while managing limited resources. Many founders and business owners are now actively looking for Data visualization services for startups that can help them track growth, monitor KPIs, and identify opportunities for improvement.
Another important benefit is real-time reporting. Instead of waiting for manual reports at the end of the week or month, businesses can access live dashboards that provide up-to-date information whenever required. This helps teams react faster to changing business conditions and improve operational performance.
Today, businesses across sectors such as finance, healthcare, education, retail, logistics, manufacturing, and technology are investing in advanced visualization platforms. Whether it is sales analysis, customer analytics, inventory tracking, financial reporting, or operational monitoring, visual dashboards help businesses understand performance more effectively.
This is where Tech Cryptors Private Limited provides customized Business Data Visualization Solutions designed to help businesses convert raw data into actionable insights. Their solutions focus on creating intuitive dashboards, reports, charts, and analytics platforms tailored to specific business requirements.
Many organizations also prefer working with an experienced Data Visualization Agency because every business has different reporting requirements. Customized dashboards provide better visibility into critical business metrics while helping management monitor performance more efficiently.
A well-designed visualization system not only improves reporting but also enhances collaboration. Teams across departments can access the same information, reducing communication gaps and ensuring that everyone works with accurate and consistent data.
As businesses continue generating larger amounts of data, the demand for intelligent reporting and visualization tools will continue to grow. Organizations that leverage data effectively often gain a significant competitive advantage through better planning, forecasting, and decision-making.
If you are searching for a reliable Data Visualization Company to create interactive dashboards, business reports, and customized analytics solutions, then Tech Cryptors Private Limited can help you build powerful Business Data Visualization Solutions that turn complex data into clear, actionable insights for business growth.